

Infographics from ACER's Teacher magazine.
-

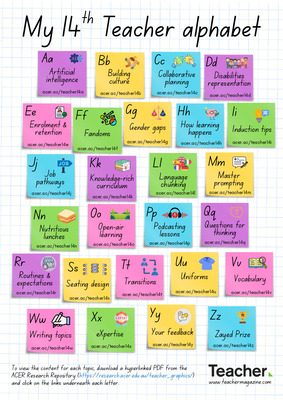
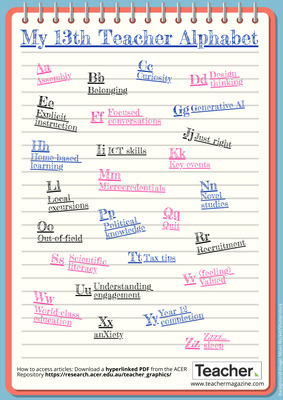
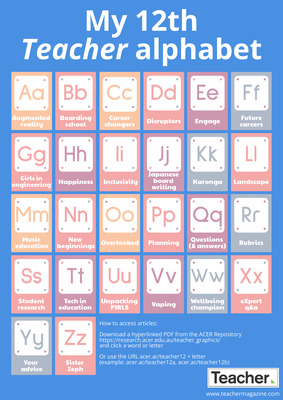
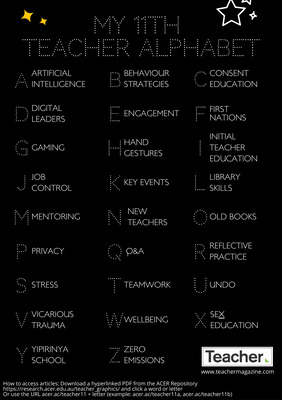
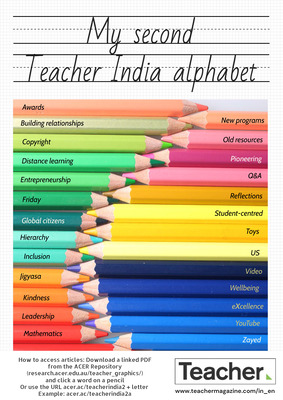
Infographic: My second Teacher alphabet
Jo Earp
What do you need information on? Differentiation? Leadership? Phonics? The second Teacher alphabet brings you quick links to popular content that you might find useful.
-

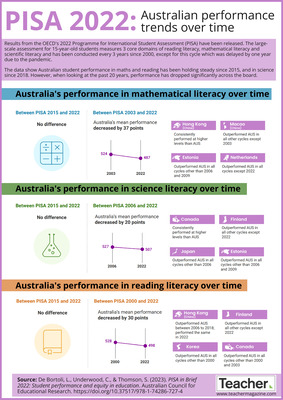
Infographic: Australia’s PISA performance over time
Jo Earp
A report on the 2015 Programme for International Student Assessment (PISA) results examines trends in Australia's average performance and the change in the percentages of students considered 'high' and 'low' performers.
-

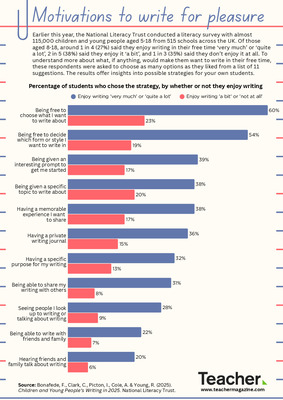
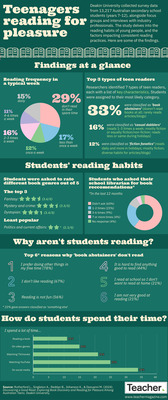
Infographic: Frequency and enjoyment of writing and reading
Jo Earp
The National Literacy Trust (UK) annual literacy survey asks eight- to 18-year-olds about writing frequency and their enjoyment of writing. Here are some of the results and comparisons with the Trust's data on reading.
-

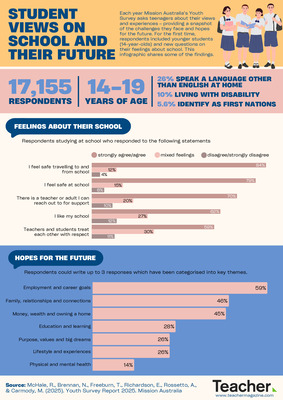
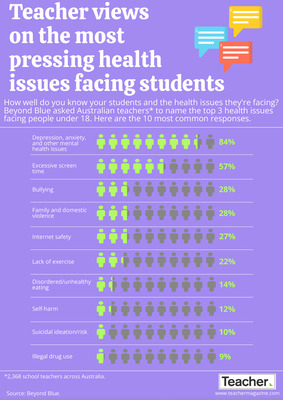
Infographic: Student health and wellbeing
Jo Earp
The Australian Child Wellbeing Project surveyed 5400 students in Year 4, 6 and 8, asking them about their lives and wellbeing during this crucial period. Here are some of the findings.
-

Infographic: Girls’ confidence
Jo Earp
A new survey suggests girls' confidence is sky high in primary school, but it nose-dives as they progress through secondary school and beyond.
-

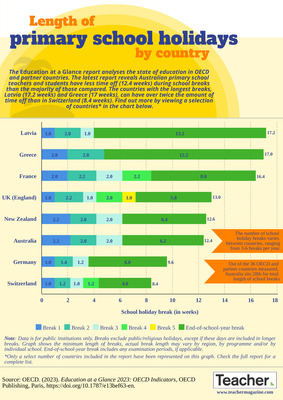
Infographic: School completion
Jo Earp
A recent study looked at the number of young people in Australia completing Year 12 or equivalent (Certificate III or higher) by the age of 19. Here are some of the findings.
-

Infographic: Out-of-field teaching
Jo Earp
A new ACER report looks at the extent to which secondary school teachers in Australia are teaching subjects they haven't specialised in during their studies. It includes data on the proportion of Years 7-10 teachers teaching out-of-field in 20 subject areas.
-

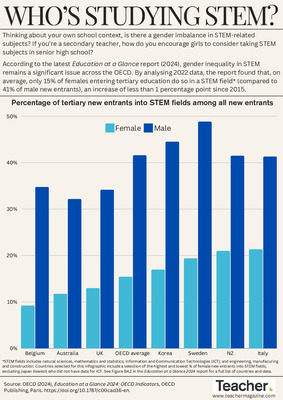
Infographic: STEM and gender
Jo Earp
A recent report from the Australian Council for Educational Research explored gender differences in relation to STEM participation, achievement and engagement. Here are some of the results.
-

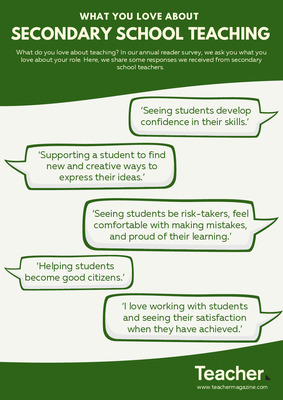
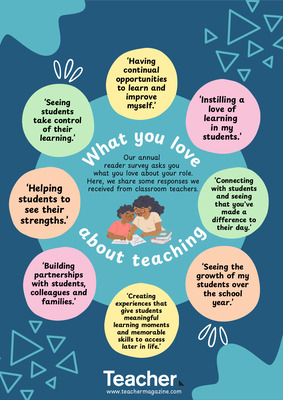
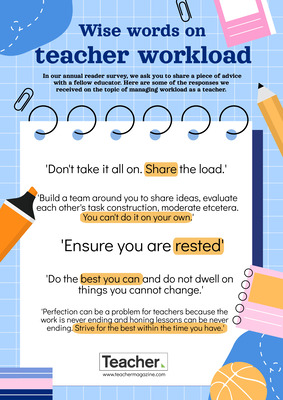
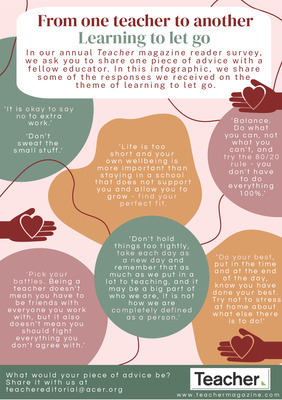
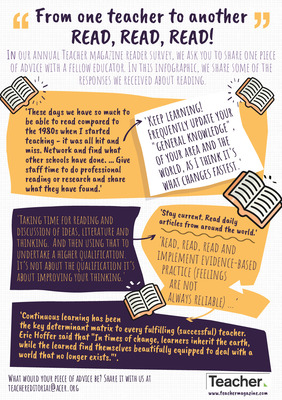
Infographic: Wise words on teacher wellbeing
Jo Earp
The 2016 Teacher reader survey includes the question: "Looking back on your experience as an educator, if you could share a piece of advice with your peers, what would it be?" Here are some of our favourite responses so far on the topic of wellbeing.
-

Infographic: How are teachers using networked technologies?
Rebecca Vukovic
From online videos to digital comics and video games – there are countless different ways teachers can use technology to support their lessons. So how are teachers using networked technologies in the classroom? Find out in this Teacher infographic.
-

Infographic: Distribution of class time
Jo Earp
The OECD Teaching and Learning International Survey (TALIS) 2013 asked lower secondary education teachers about the distribution of class time during the average lesson. So, how much time is actually spent on teaching and learning?
-

Infographic: Preparing teachers for the classroom
Jo Earp
In the experience of Australian Principals, how well prepared are recent teacher graduates in relation to areas such as dealing with difficult student behaviour, making effective use of ICT, and subject content knowledge? Find out in today's infographic.
-

Infographic: STEM workforce and careers
Jo Earp
School educators are being encouraged to give students more information about STEM-related careers. So, what are the top occupations of STEM graduates? Find out in this Teacher infographic.
-

Infographic: Teachers working in Australian school libraries
Jo Earp
What is the percentage of Australian teachers working in school libraries? Are those teachers mainly female or male? Find out in this infographic.
-

Infographic: Time spent on homework
Danielle Meloney
How much time do 15-year-olds spend per week on homework and other tasks set by teachers after school? An OECD report explored.
-

Infographic: Principals’ experiences of offensive behaviour
Danielle Meloney
A 2015 study looked at the percentage of Australian principals who have had negative experiences in the workplace. Here are some of the results.
-

Infographic: The Teacher alphabet
Jo Earp
What do you need information on? Homework? Behaviour? Mindset? The Teacher alphabet brings you quick links to popular content that you might find useful.
-

Infographic: Declining maths participation
Danielle Meloney
The Australian Mathematical Sciences Institute has highlighted a slide in Year 12 high-level mathematics participation over the past 20 years.
-

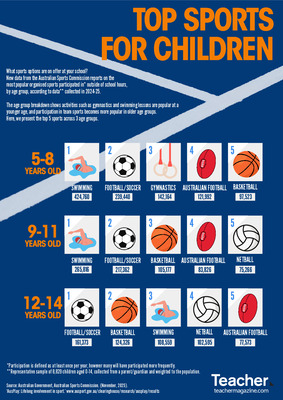
Infographic: Popular sports amongst youngsters
Jo Earp
Looking to set up a lunchtime or afterschool sports club this year? This infographic might offer some inspiration. Here are the three most popular sports Australian six-to 13-year-olds like to participate in.
-

Infographic: ICT skills and student self-efficacy
Jo Earp
How confident do Australian Year 10 students feel when doing ICT-related tasks? Today’s infographic explores.
-

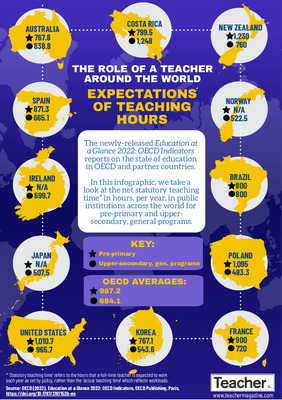
Infographic: Teaching hours
Jo Earp
How does Australia compare with other countries when it comes to the number of teaching hours in primary, lower secondary and upper secondary? Find out in today's infographic.
-

Infographic: Teaching hours - Part 2
Jo Earp
In the second part of Teacher's infographic on teaching hours, we look at how the United Kingdom compares with other countries when it comes to the number of teaching hours in primary, lower secondary and upper secondary.
-

Infographic: Formats of writing outside school
Danielle Meloney
What do children and young people most commonly write outside school time? The National Literacy Trust UK recently explored.
-

Infographic: Educational philanthropy
Jo Earp
Is there a disconnect when it comes to the areas that schools, non-profits and philanthropics are keen to focus on? Find out in this Teacher infographic.
-

Student access to software resources
Danielle Meloney
Do students in Australia have ready access to software resources in comparison with other countries? A recent report offers some interesting insights.