

Infographics from ACER's Teacher magazine.
-

Infographic: Teacher attitudes towards STEM
Dominique Russell
Teachers can have a key influence on the career choices of young people, so knowing their attitudes towards STEM can help us understand how students are being influenced in the school environment. Here, we share results of a survey capturing teacher attitudes towards STEM.
-

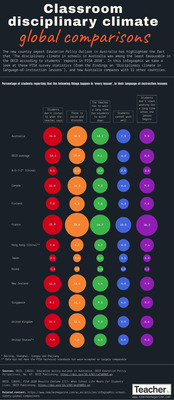
Infographic: Issues hindering school instruction
Jo Earp
In the Southeast Asia Primary Learning Metrics (SEA-PLM) 2019 assessment programme, school principals were asked about issues that hindered their school’s capacity to provide instruction. This infographic shows the proportions of children in the six SEA-PLM 2019 countries who attended a school where the principal reported each issue hindered school capacity to a 'large' or 'moderate' extent.
-

Infographic: School librarian recruitment – valuing reading for pleasure
Dominique Russell
A new study has explored job titles and descriptions for school librarian jobs advertised in the United States and Australia to assess the emphasis placed on a school librarian’s role in promoting reading for pleasure. Researchers found ‘Australian school librarians are far more likely to be expected to foster reading for pleasure’.
-

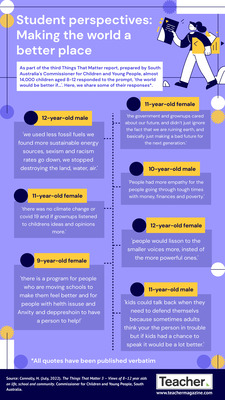
Infographic: Students’ experiences and perceptions of harmful sexual behaviour
Dominique Russell
More than 900 students aged 13 and above were surveyed about ‘the prevalence of peer-on-peer sexual harassment and sexual violence, including online, in their lives and the lives of their peers’ as part of a rapid review in the UK. Here, we share how boys and girls responded, which shows boys were much less likely to think these things occurred.
-

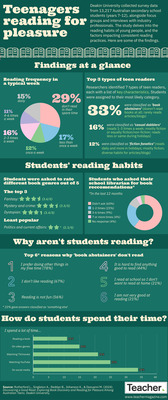
Infographic: Student enjoyment of reading
Dominique Russell
The most recent Programme for International Student Assessment (PISA) survey measured the attitudes held by 15-year-olds on reading. An Australian Council for Educational Research (ACER) Snapshot report has analysed these attitudes, and looked at how they differ between girls and boys, Indigenous and non-Indigenous students, and most disadvantaged and least disadvantaged students.
-

Infographic: Foundational literacy and numeracy skills
Jo Earp
In the Trends in International Mathematics and Science Study (TIMSS) 2019, Year 4 principals were asked to report how many students in their school could do foundational literacy and numeracy skills such as ‘write their names’ and ‘recognise written numbers from 1 to 10’ when they began their first year of primary school. Find out how Australian data compare to the international average in this infographic.
-

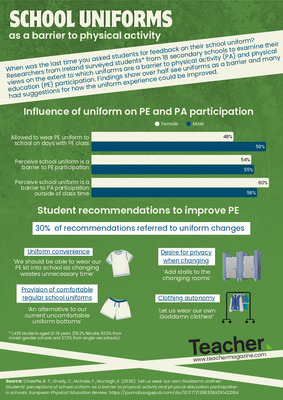
Infographic: What girls want in school sport uniforms
Dominique Russell
Victoria University surveyed 727 girls aged 12 to 18 to gain insight into their preferences and opinions on sport uniforms. Here, we share what clothing they prefer to wear during school sport and their reasons why. The researchers say findings from the study could enhance school and sport club uniform policy.
-

Infographic: Principal demographics
Dominique Russell
The annual Australian Principal Occupational Health, Safety and Wellbeing Survey collects information on the experiences of school leaders and their state of health and wellbeing. Part of the survey includes collecting demographic data on survey respondents. Here, we look at the age distribution of over 1800 respondents in 2020.
-

Infographic: Teachers who work second jobs
Jo Earp
A new paper explores US data on public school teachers working a second job, outside the education system. What proportion of full-time teachers worked a second job? What type of jobs did they take? And, what were their average earnings? Find out in this infographic.
-

Infographic: Effectiveness of remote learning during COVID
Jo Earp
McKinsey surveyed teachers around the world for their views on the effectiveness of remote learning during the COVID-19 school closures. Teachers were asked to reflect on their experiences in the first few months of the pandemic, scoring the effectiveness on a scale of one to 10. Find out the results in today’s infographic.
-

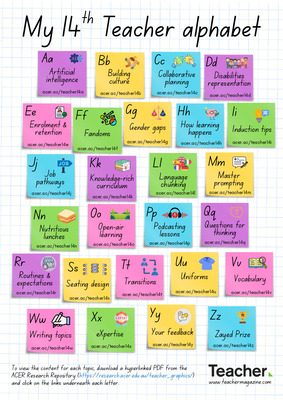
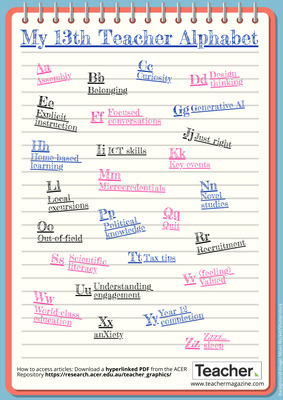
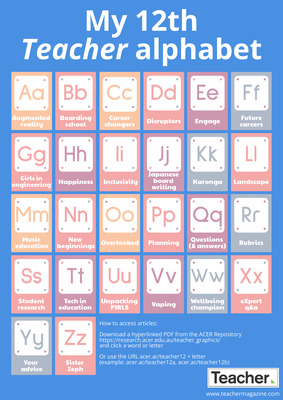
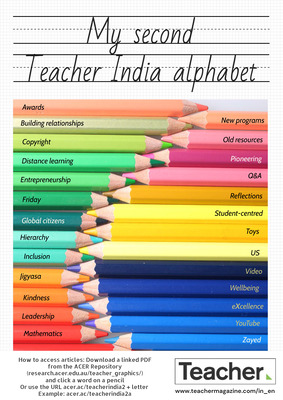
Infographic: My Teacher alphabet #1
Jo Earp
What do you need information on? Online learning? How to support your students after the COVID-19 school closures? School leadership? How to introduce higher order thinking skills into your lesson planning? This Teacher alphabet brings you quick links to popular content from our Southeast Asia site that you might find useful.
-

Infographic: Women in secondary principal roles
Dominique Russell
A literature review has looked at the current state of female representation in secondary principal roles in New Zealand, Here, we look at how the percentage of women in secondary principal roles has changed over the past three decades.
-

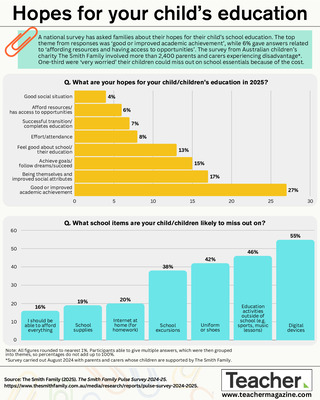
Infographic: Parents’ views on the role of education
Jo Earp
What should and should not be the responsibility of schools? A nationwide poll by the Australian National University asked parents and carers to consider this question in relation to 15 statements. Today’s infographic takes a look at the results.
-

Infographic: Student attitudes towards Australian Indigenous cultures
Jo Earp
In Australia, one of the aims of civics and citizenship education is to develop understanding and appreciation of Indigenous histories and cultures. This infographic looks at students’ attitudes towards Aboriginal and Torres Strait Islander cultures, traditions and peoples.
-

Infographic: Learning about other countries and cultures
Jo Earp
What opportunities do school students have to learn about other cultures, perspectives, and global events? Students participating in PISA 2018 were asked 10 questions about the different learning activities they are exposed to. Today’s infographic looks at the OECD average results.
-

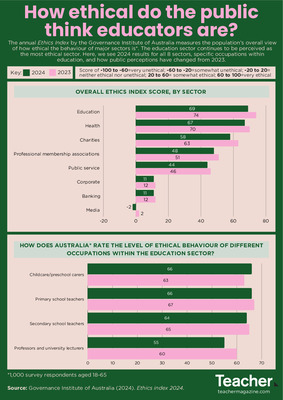
Infographic: The professions viewed as most ethical by the public
Dominique Russell
A recent survey measured public attitudes to ethical conduct across society. In this infographic, you can see how each occupational sector scored in the Ethics Index for 2020, and how different occupations within the education sector are viewed by the public.
-

Infographic: Rural, regional and remote professional learning
Dominique Russell
AITSL conducted surveys in 2018 and 2019 on the current arrangements of professional learning in rural, regional and remote schools across the country. Here, we look at some of the survey responses from teachers on their experiences.
-
")
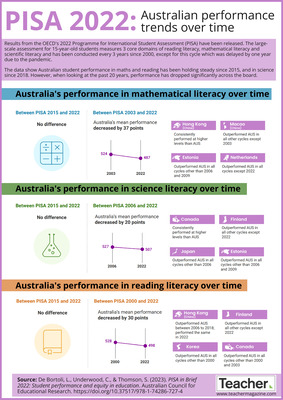
Infographic: Australian achievement trends in TIMSS
Australian Council for Educational Research (ACER)
Trends in International Mathematics and Science Study (TIMSS) measures how well Year 4 and Year 8 students from around the world are performing in science and mathematics. In this infographic we look at Australian student achievement over time.
-

Infographic: My eighth Teacher alphabet
Jo Earp
What do you need information on? Strategies for implementing school improvement? Resources for building cultural responsiveness? Ideas for online excursions? The eighth Teacher alphabet brings you quick links to popular content that you might find useful.
-

Infographic: Remote learning during COVID-19
Jo Earp
To assess student access to remote learning during school closures due to COVID-19, UNICEF collected data about broadcast (television and radio) and digital (internet-based) instruction policies from more than 100 ministries of education around the world. Today’s infographic shares some of the findings.
-

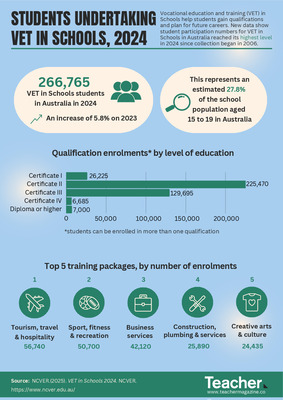
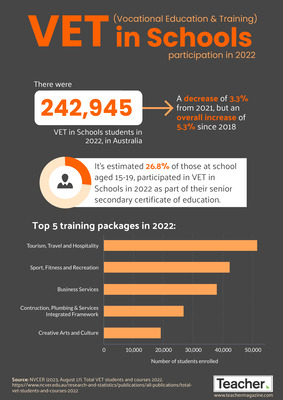
Infographic: VET in Schools
Jo Earp
Annual data on school students in Australia undertaking vocational education and training (VET) as part of their Senior Secondary Certificate of Education has been released by NCVER. Today’s infographic looks at the headline figures, qualification levels and the most popular training packages for 2019.
-

Infographic: Public perceptions of the teaching profession
Jo Earp
Researchers from Monash University surveyed teachers and members of the public in Australia about public perceptions of the teaching profession. Today’s infographic takes a look at the responses on the topic of appreciation.
-

Infographic: Student word choice during a pandemic
Dominique Russell
Children aged 8-14 in Australia recently submitted a 100 word story responding to the prompt ‘A different world – living in lockdown’ for a story-writing event. Their word choices were analysed and in this infographic, we see how their word choices compare to previous instalments of the event.
-

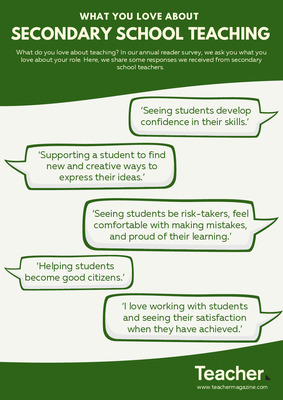
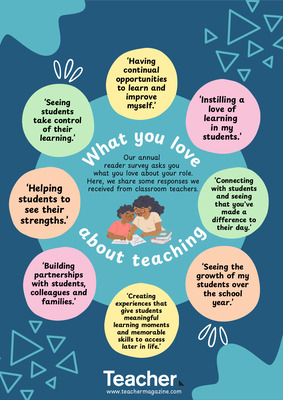
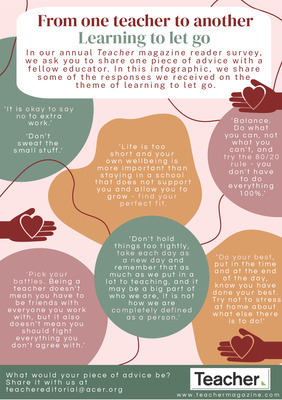
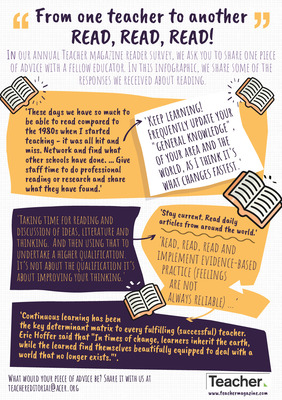
Infographic: From one teacher to another
Jo Earp
Each year, we ask readers to share a piece of advice. In today’s infographic we share some of the responses we’ve received on teaching and leading. What would your piece of advice be?
-

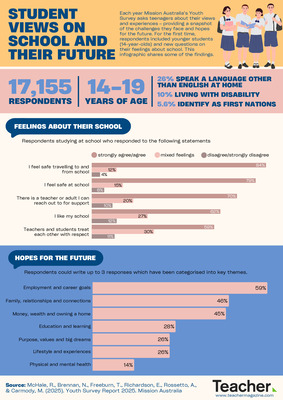
Infographic: Students living with disability
Dominique Russell
A recent survey conducted by Mission Australia highlights how the experiences of young people with a disability differ to young people living without disability. Topics included inclusion, issues of personal concern and post-school plans. Here, we look at how some of their responses compare.