

Infographics from ACER's Teacher magazine.
-

Infographic: Language and cognitive skills in the early years
Zoe Kaskamanidis
Results from the 2021 Australian Early Development Census (AEDC) collection cycle show that of all early childhood developmental domains, children’s language and cognitive skills have seen the most significant shift. Find out more in today’s infographic.
-

Infographic: From one teacher to another – planning
Zoe Kaskamanidis
In our annual Teacher magazine reader survey, we ask you to share one piece of advice with a fellow educator. In this infographic, we share some of the responses we received about planning.
-

Infographic: Four- and five-year-olds' achievement during the pandemic
Dominique Russell
A recent study has analysed the experience of over 3000 children aged four and five attending preschool in the United Kingdom during the COVID-19 pandemic. Children's achievement in prime learning areas, as well as their overall development, during September 2020 and July 2021, were compared to national pre-pandemic averages recorded in the 2018/19 school year.
-

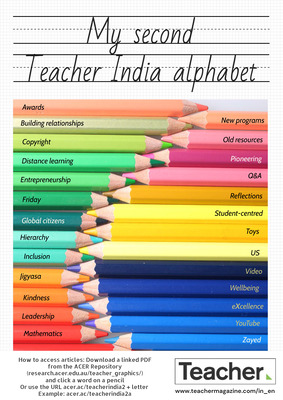
Infographic: My first Teacher India alphabet
Zoe Kaskamanidis
What do you need information on? Inclusivity? Engaging with parents? Virtual learning? The first Teacher India alphabet brings you quick links to popular content that you might find useful. Download the PDF for a hyperlinked version.
-

Infographic: Leaving teaching
Zoe Kaskamanidis
A new study from Monash University draws upon a 2019 questionnaire of 2444 Australian primary and secondary school teachers, revealing that only 41% of respondents intended to remain in the profession. We look at some of the findings from the analysis in this infographic.
-

Infographic: Science teaching – women physicists your students should know about
Jo Earp
A new study has found in the most recent New South Wales HSC Physics syllabus 10 individuals are mentioned and all are men, and in the last 25 years physicists have been mentioned 211 times in the subject examinations and, again, all were men. In today’s infographic we share just three (there are many more!) amazing women physicists to tell your students about.
-

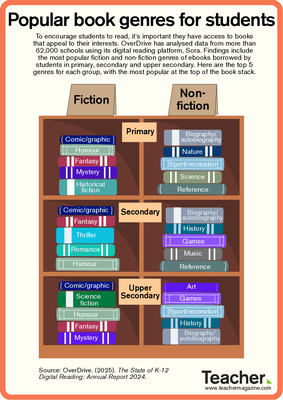
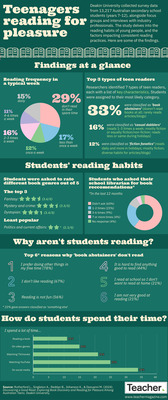
Infographic: Student reading in a digital age
Zoe Kaskamanidis
An OECD report 21st-Century Readers: Developing Literacy Skills in a Digital World analyses data from the 2018 PISA test and student survey to report on the reading habits of 15-year-olds in OECD countries. Find out more about how reading in digital and paper formats effects students' reading performance and enjoyment in today's infographic.
-

Infographic: Supporting students with ADHD
Zoe Kaskamanidis
National charity ADHD Australia surveyed 1024 primary, secondary and tertiary educators in all Australian states and territories to identify their knowledge, training and experience to support students with Attention Deficit Hyperactivity Disorder (ADHD). Find out more in today’s infographic.
-

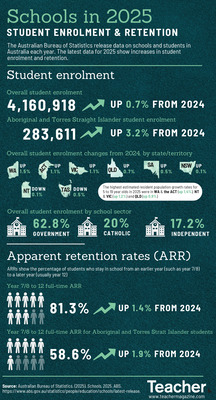
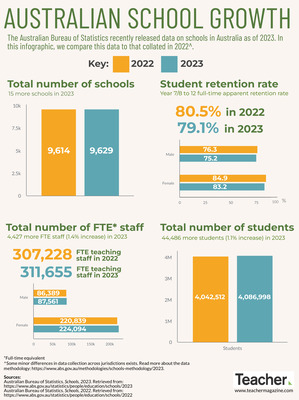
Infographic: Schools in 2021
Dominique Russell
How many students were enrolled in how many schools across Australia throughout 2021? How many full-time equivalent staff members? What was the average student-teacher ratio? Find out what schools looked like in 2021 in today’s infographic.
-

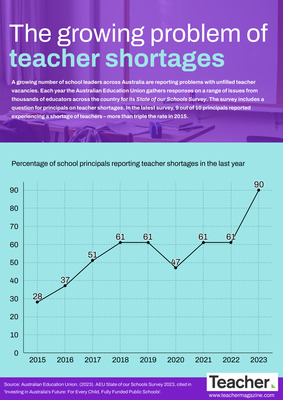
Infographic: Principal health and wellbeing
Dominique Russell
The annual Australian Principal Occupational Health, Safety and Wellbeing Survey 2021 data show school leaders continue to experience negative health and wellbeing. In this infographic, we explore the survey results for various aspects of health and wellbeing.
-

Infographic: The impact of COVID-19 on education – UNESCO REDS
Zoe Kaskamanidis
The Responses to Educational Disruption Survey (REDS) explores how the pandemic has impacted lower secondary education, investigating how 11 countries approached the challenge of ensuring continuity in teaching and learning during the disruption. Find out more about insights from the survey in today's infographic.
-

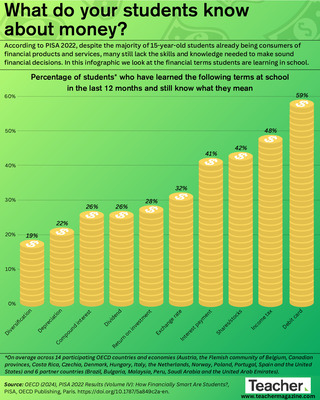
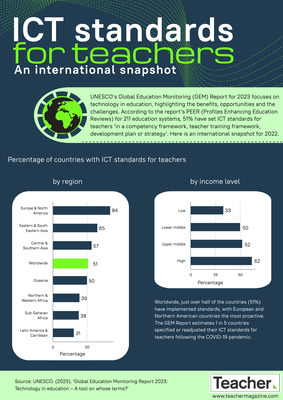
Infographic: Financial education in schools
Jo Earp
An Australian survey has found that the vast majority of teachers value financial education, but only 52 per cent had taught it at school, and only 21 per cent in the last year. Find out more about their responses and the finance-related topics that students of different ages would like to learn about in today's infographic.
-

Infographic: My tenth Teacher alphabet
Zoe Kaskamanidis
What do you need information on? High-impact school leadership? Data in action? Using quality mentor texts? Online safety? The tenth Teacher alphabet brings you quick links to popular content that you might find useful.
-

Infographic: School funding – what are educators seeking support for?
Dominique Russell
Philanthropic funding is one way school leaders can access support to implement and enhance initiatives and projects. Australian charity Schools Plus recently published details of applications for its latest round of grants. The requests from schools provide a snapshot of the initiatives and projects educators are seeking funding for.
-

Infographic: Measures taken during school closures
Dominique Russell
An OECD survey explored how 27 education systems across the globe responded during school closures in 2020. This infographic shows how widely nine different measures were used for at least one level of schooling to target students at risk of exclusion from distance education platforms.
-

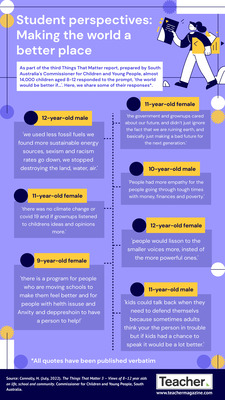
Student views on starting high school
Dominique Russell
Forums held with students in Years 6, 7 and 8 in Australia on the topic of starting high school have shed light on what concerns them the most about the transition process, and what has been helpful to them along the way. Here, we share some comments from the students.
-

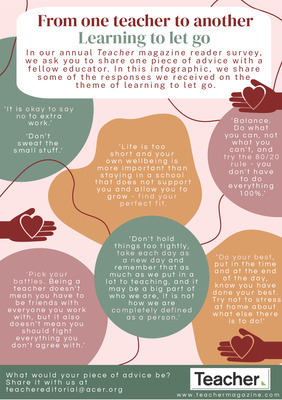
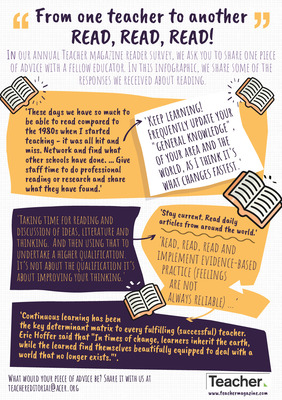
Infographic: From one teacher to another – switching off from work
Dominique Russell
In our annual Teacher magazine reader survey, we ask you to share one piece of advice with a fellow educator. As the school holidays approach, in this infographic, we share some of the responses we received about the importance of switching off from work.
-

Infographic: Global status of teachers
Dominique Russell
A survey of education officials and union leaders from all levels of education in 94 countries has given insight into how the teacher profession is viewed at a global scale. In this infographic, we share some of the survey responses in relation to K-12 settings.
-

Infographic: Student effort when taking tests
Jo Earp
A new issue of Snapshots, from the Australian Council for Education Research (ACER), looks at self-reported levels of effort students invested in the PISA (Programme for International Student Assessment) 2018 test. Today’s infographic looks at the percentage of students in 20 participating countries and economies who indicated they would have invested more effort in the test if it counted towards their school marks.
-

Infographic: Indigenous students experiencing racial discrimination at school
Dominique Russell
Data collected from Aboriginal and Torres Strait Islander children aged between 10 and 15 years old highlights the prevalence of racism and racial discrimination experienced by young people. Here, we share their responses to seven statements relating to self-reported experiences of direct racial discrimination in a school setting.
-

Infographic: Students' awareness of global issues
Jo Earp
The latest edition of Snapshots, from the Australian Council for Educational Research (ACER), digs into PISA 2018 data to explore the question: How aware of global issues are Australian 15-year-olds? Students were asked to report the extent to which they knew about seven issues. Today’s infographic looks at some of the results.
-

Infographic: Psychological distress among young people
Jo Earp
A new Mission Australia and Black Dog Institute report has analysed Mission Australia Youth Survey findings from 2012-20 to better understand psychological distress faced by 15- to 19-year-olds in Australia. Data show there has been a significant increase in the proportion of young people experiencing mental health challenges. Find out more in today’s infographic.
-

Infographic: Having a desk and a quiet place to study
Jo Earp
Whether it's completing homework assignments, preparing for exams, or being required to study remotely during the COVID-19 pandemic, teenage students often need to complete school work at home. But, how many have access to a desk and a quiet place to study? What about those from the most disadvantaged backgrounds?
-

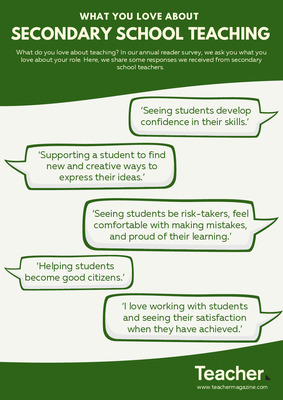
Infographic: Wise words on working with students
Dominique Russell
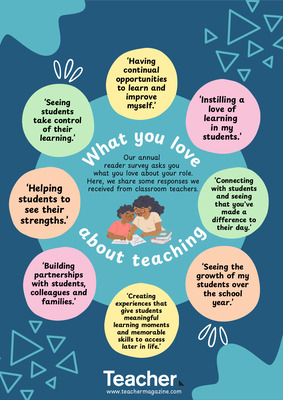
Each year, in the Teacher survey, we ask our readers to share one piece of advice they'd give to a fellow educator. Here, we share some responses from our 2020 survey on the topic of working collaboratively with students.
-

Infographic: My ninth Teacher alphabet
Jo Earp
What do you need information on? Evidence-based practice? Tutoring in schools? Oral language? Data interpretation? The ninth Teacher alphabet brings you quick links to popular content that you might find useful. Download the PDF for a hyperlinked version.