

Infographics from ACER's Teacher magazine.
-

Infographic: News and young Australians
Dominique Russell
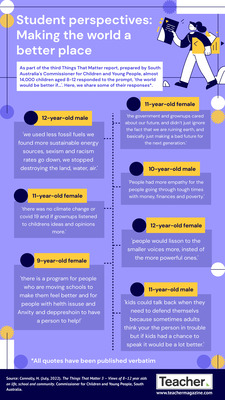
A survey of young Australians has illustrated how young people access, perceive and are affected by news media. Here, we look at some of the key findings from the survey, which was conducted following the bushfire crisis and at the beginning of the COVID-19 pandemic.
-

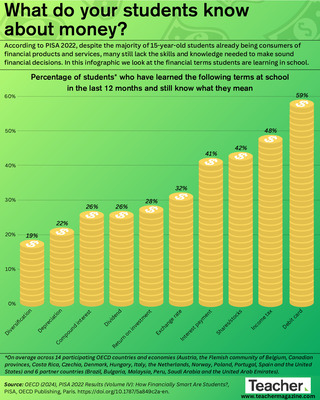
Infographic: Proficiency in financial literacy
Dominique Russell
The Programme for International Student Assessment (PISA) examines student understanding about money matters. Here, we look at 15-year-old students’ understanding of and attitudes towards money in the 20 countries and economies that participated in this optional portion of the assessment in 2018.
-

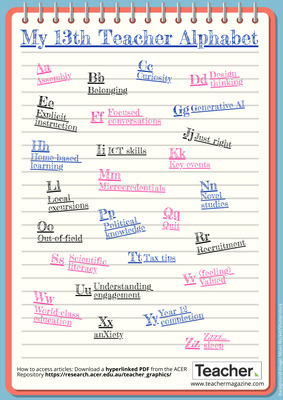
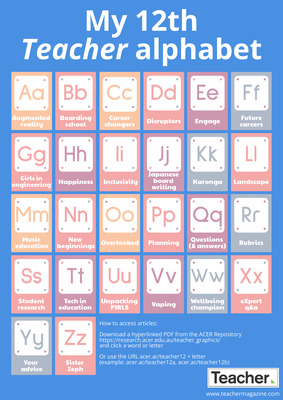
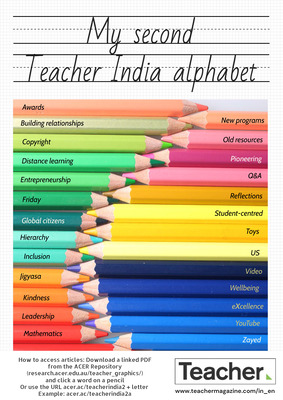
Infographic: My seventh Teacher alphabet
Jo Earp
What do you need information on? Strategies for identifying and supporting gifted learners? Digital literacy? Learning Walks and Talks? Indigenous perspectives in maths? The seventh Teacher alphabet brings you quick links to popular content that you might find useful.
-

Infographic: Principal wellbeing – Sources of stress and support
Dominique Russell
The latest Principal Health and Wellbeing Survey reveals 19 sources of stress for school leaders. In this infographic, we look at the top 10 sources of stress reported by school leaders, and their top 5 sources of support.
-

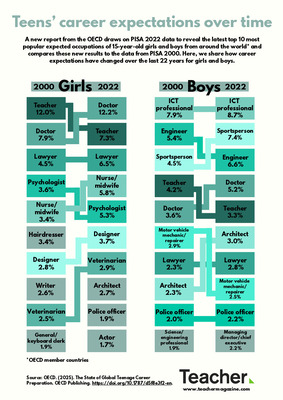
Infographic: Teenage career expectations over time
Dominique Russell
A new report from the OECD explores the career aspirations of 15-year-olds from across the world. In this infographic, we look at the percentage of boys and girls expecting to work in one of the 10 most commonly cited jobs when they are 30 years old, and how their career choices have changed over time.
-

Infographic: Wise words on professional development
Dominique Russell
Each year in the Teacher reader survey, we ask you: ‘looking back on your experience as an educator, if you could share one piece of advice with your peers, what would it be?’ In this infographic, we take a look at some of your responses on the topic of professional development.
-

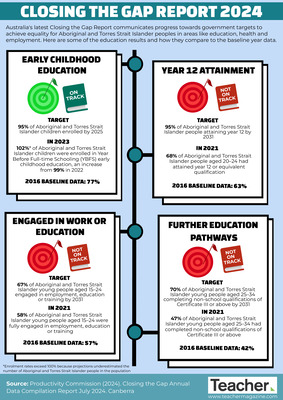
Infographic: Closing the Gap Report 2020
Dominique Russell
Australia’s annual Closing the Gap Report communicates progress towards government targets for Indigenous Australians in areas like education, health and employment. In this infographic, we take a look at results detailed in the 2020 report related to education targets.
-

Infographic: Principals’ working time
Jo Earp
The latest cycle of the Teaching and Learning International Survey (TALIS 2018) asked principals in Australia about the time they allocated to various tasks throughout the year, including curriculum-and teaching-related tasks and meetings, administrative tasks and meetings, and student interactions. This infographic takes a look at the results.
-

Infographic: Child online safety
Dominique Russell
Results of a cyber safety survey conducted over three years with respondents from 30 different countries have recently been released. DQ Institute surveyed 145 426 children and adolescents on issues related to cyber safety to assess which countries are considered safest.
-

Infographic: Sleep and schoolwork
Jo Earp
A new Health Behaviour in School Aged Children study offers insights into the lives of 11- to 15-year-olds in England. Our latest infographic looks at the proportions of young people who reported not having enough sleep to be able to concentrate on their schoolwork, and how the figures have changed since 2014.
-

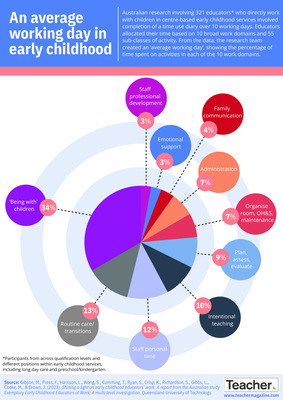
Infographic: A teacher’s weekly workload
Jo Earp
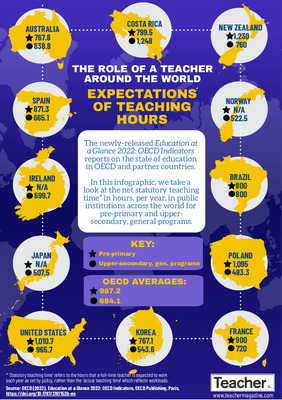
The OECD Teaching and Learning International Survey (TALIS 2018) asked teachers about their working hours. This infographic shows the average number of hours teachers in Australia reported having spent on a range of activities in the most recent calendar week prior to the survey, including during weekends, evenings and other out-of-class time.
-

Infographic: Wise words on collaboration
Dominique Russell
What advice would you offer to your peers, thinking about your experience as an educator? We put this question to you in our annual reader survey. This infographic looks at some of the responses we received on the topic of collaboration.
-

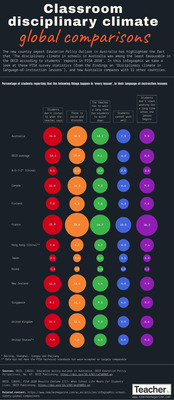
Infographic: School safety – global comparisons
Jo Earp
The latest OECD Teaching and Learning International Survey (TALIS 2018) asked principals about safety at their school, including incidents of bullying and cyberbullying, intimidation or verbal abuse of teachers and staff, and violence among students. Today’s infographic compares results from Australia to six other countries and global averages.
-

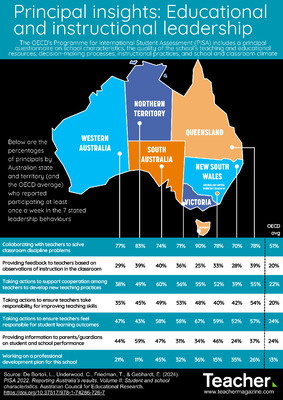
Infographic: PISA 2018 – Australian results by state and territory
Jo Earp
The OECD's Programme for International Student Assessment (PISA) measures how well 15-year-olds are prepared to use their skills and knowledge to meet real-life challenges. The 2018 data show Australian student performance in all three assessment domains is in long-term decline. This infographic looks at the low and high performers by jurisdiction.
-

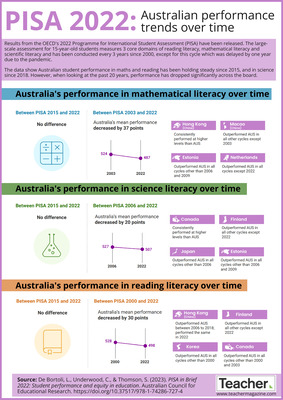
Infographic: PISA 2018 – Australian trends and comparison
Jo Earp
Results from the OECD's 2018 Programme for International Student Assessment (PISA) have been released. The data show Australian student performance is in long-term decline. This infographic looks at Australia’s PISA performance over time, and how the 2018 results compare internationally.
-

Infographic: Students with disability
Jo Earp
Advocacy group Children and Young People with Disability Australia sought the views of almost 500 parents and carers of primary and secondary students with disability for its 2019 National Education Survey. Today’s infographic looks at some of the main findings.
-

Infographic: Students, teachers and private tutoring
Jo Earp
Two new UK surveys shine a light on how many secondary school students have used a private tutor outside school, and how many primary and secondary teachers have carried out tutoring in their own time.
-

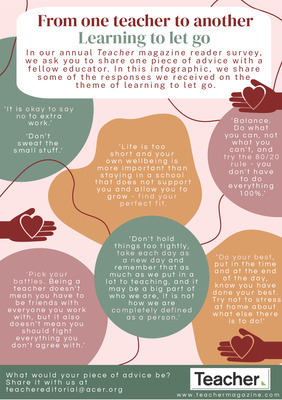
Infographic: Wise words on lifelong learning
Dominique Russell
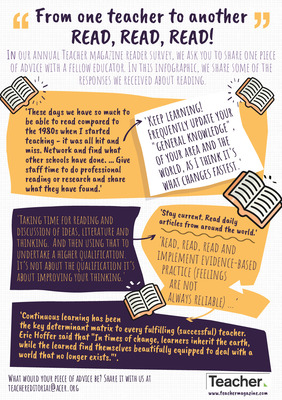
Each year in our reader survey, we ask you: ‘looking back on your experience as an educator, if you could share one piece of advice with your peers, what would it be?’ In this infographic, we take a look at some of your responses on the topic of lifelong learning.
-

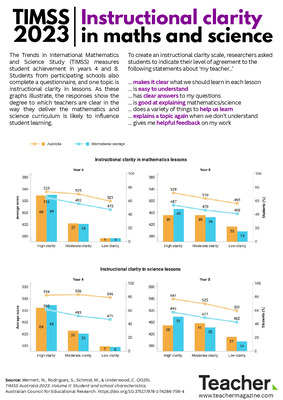
Infographic: Teaching practices – Clarity of instruction
Jo Earp
As a classroom teacher, how often do you explain what you expect students to learn, or how old and new topics are related? The latest OECD Teaching and Learning International Survey (TALIS 2018), asked participants about their use of a range of teaching practices associated with clarity of instruction. Today’s infographic takes a look at the results.
-

Infographic: My sixth Teacher alphabet
Jo Earp
What do you need information on? Effective classroom questioning techniques? How to build a reading culture at your school? Inclusive transition programs? Building staff expertise? The sixth Teacher alphabet brings you quick links to popular content that you might find useful.
-

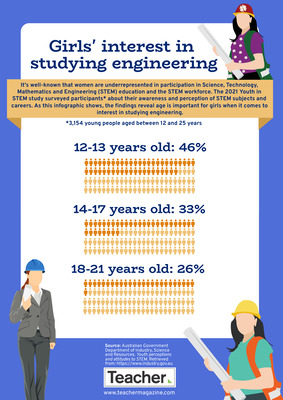
Infographic: Student attitudes towards STEM
Dominique Russell
The Australian Department of Industry, Innovation and Science commissioned a study to examine the attitudes of Australian students towards STEM (Science, Technology, Engineering, Mathematics). In this infographic, we take a look at some of the findings.
-

Infographic: School attendance and mental health disorders
Kristen Owen
Mental disorders are a significant cause of absence, particularly in high school, a new examination of data from the Australian Child and Adolescent Survey of Mental Health and Wellbeing shows. Today’s infographic looks at some of the results across Years 1-12.
-

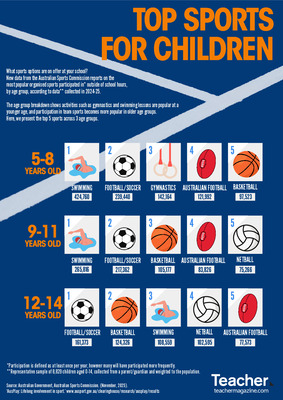
Infographic: Top sports by gender
Dominique Russell
A recent survey has revealed the top five sports for boys and girls in Australia at different age groups. See how the popularity in physical activities differs between genders in this infographic.
-

Infographic: Teaching practices – Cognitive activation
Jo Earp
In the latest cycle of the OECD’s Teaching and Learning International Survey (TALIS 2018), participants were asked about their use of a range of teaching practices. Today’s infographic looks at the results for practices associated with cognitive activation.
-

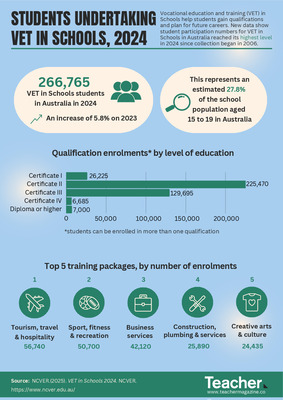
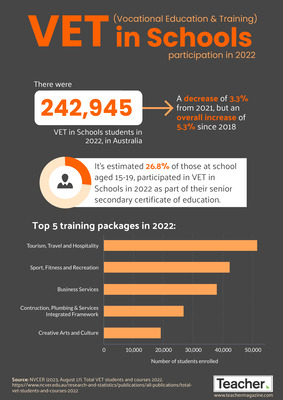
Infographic: Participation rates in VET
Dominique Russell
A new report provides an overview of the participation rates of secondary students in VET (Vocational Education and Training) Programs across Australia. In this infographic, we look at the figures for 2017.