

Infographics from ACER's Teacher magazine.
-

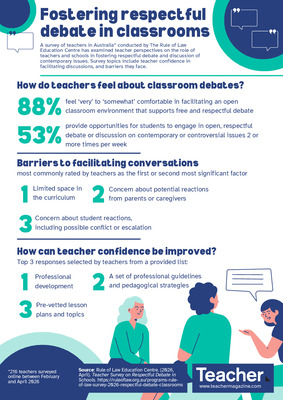
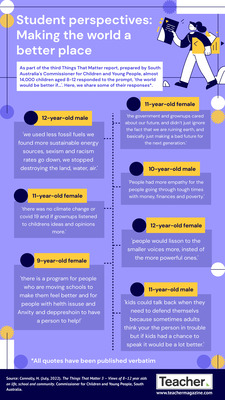
Infographic: Fostering respectful debate in classrooms
Dominique Russell
A survey of teachers in Australia has examined teacher perspectives on the role of teachers and schools in fostering respectful debate and discussion of contemporary issues. Survey topics include teacher confidence in facilitating discussions, and the barriers they face.
-

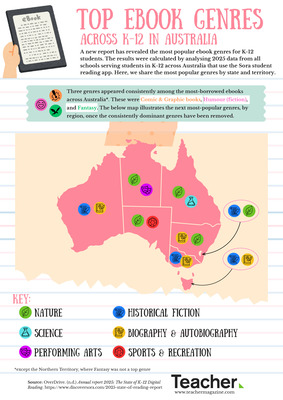
Infographic: Top ebook genres across K-12 in Australia
Dominique Russell
A new report has revealed the most popular ebook genres for K-12 students. The results were calculated by analysing 2025 data from all schools serving students in K-12 across Australia that use the Sora student reading app. Here, we share the most popular genres by state and territory.
-

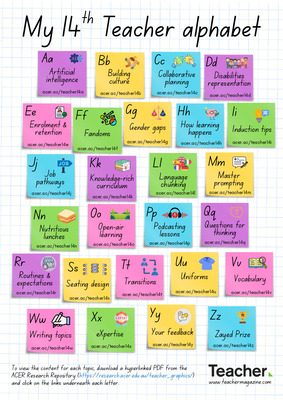
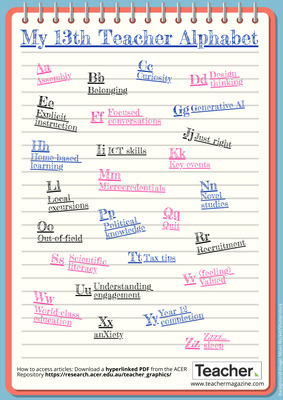
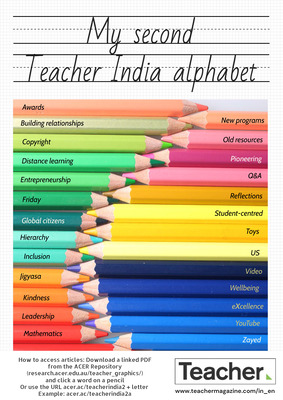
Infographic: My 14th Teacher alphabet
Dominique Russell
What do you need information on? Artificial intelligence? Transitions? Seating designs? The 14th Teacher alphabet brings you quick links to popular content that you might find useful. Download the PDF for a hyperlinked version so you can access the content for each letter.
-

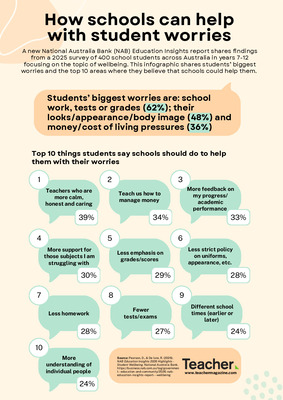
Infographic: How schools can help with student worries
Dominique Russell
A 2025 survey of 400 school students across Australia in years 7-12 focused on the topic of wellbeing. This infographic shares some of the results related to students’ biggest worries and the top 10 areas where they believe that schools could help them.
-

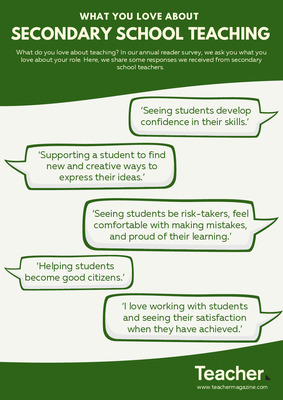
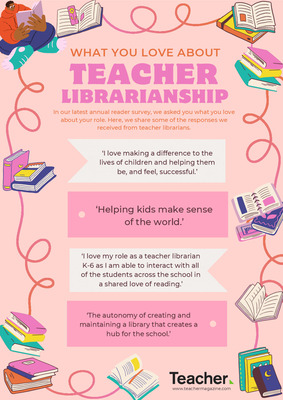
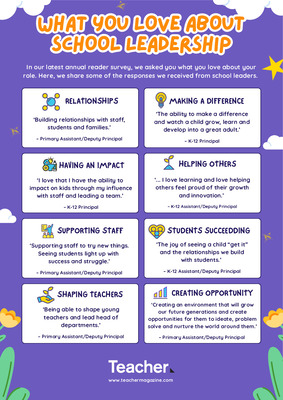
Infographic: What you love about secondary school teaching
Dominique Russell
What do you love about teaching? In our annual reader survey, we ask you what you love about your role. Here, we share some responses we received from secondary school teachers.
-

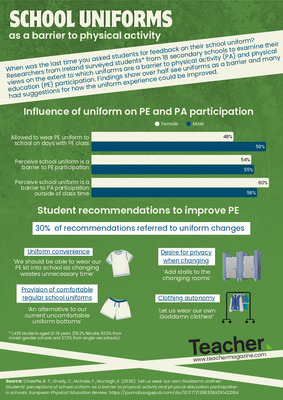
Infographic: School uniforms as a barrier to physical activity
Dominique Russell
Researchers from Ireland surveyed students to examine their views on the extent to which uniforms are a barrier to physical activity and physical education participation. Findings show over half see uniforms as a barrier and many had suggestions for how the uniform experience could be improved.
-

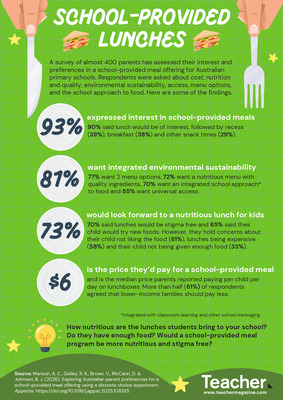
Infographic: School-provided lunches
Dominique Russell
A survey of almost 400 parents has assessed their interest and preferences in a school-provided meal offering for Australian primary schools. Respondents were asked about cost, nutrition and quality, environmental sustainability, access, menu options, and the school approach to food. Here are some of the findings.
-

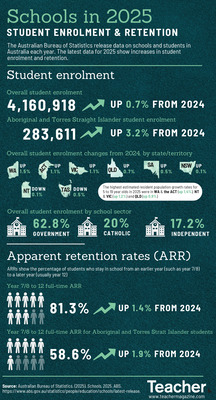
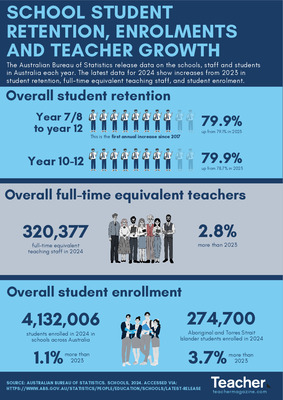
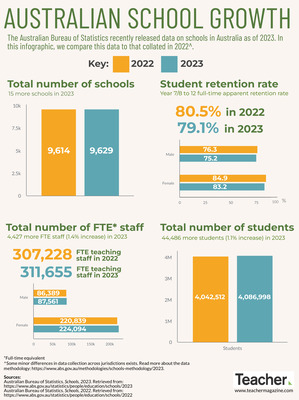
Infographic: Schools in 2025 – student enrolment and retention
Dominique Russell
The Australian Bureau of Statistics release data on schools and students in Australia each year. The latest data for 2025 show increases in student enrolment and retention. Find out more in this infographic.
-

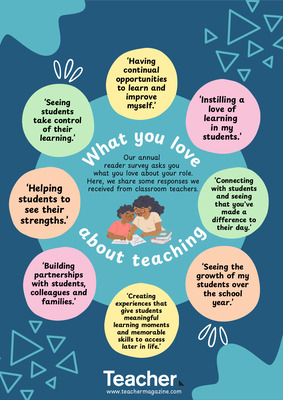
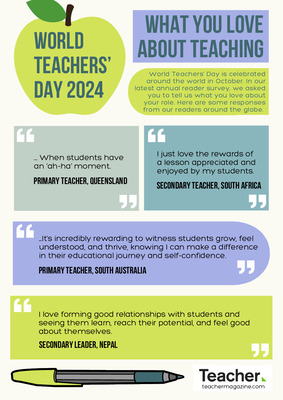
Infographic: What do you love about teaching?
Dominique Russell
What do you love about being a teacher? Our annual reader survey includes an invitation for you to share what you love about your role in education. In this infographic, we share some of the latest responses received from classroom teachers.
-

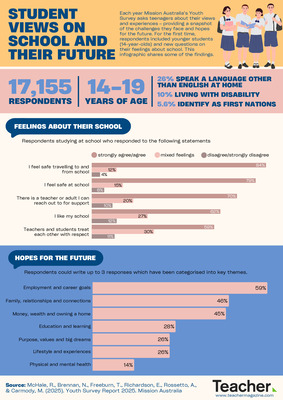
Infographic: Student views on school and their future
Dominique Russell
Each year Mission Australia’s Youth Survey asks teenagers about their views and experiences – providing a snapshot of the challenges they face and hopes for the future. For the first time, respondents included younger students (14-year-olds) and new questions on their feelings about school. This infographic shares some of the findings.
-

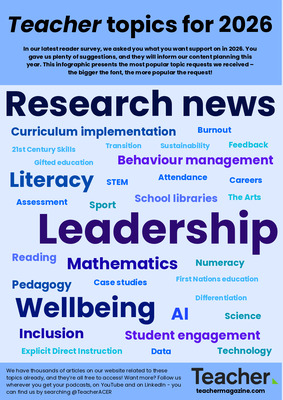
Infographic: Topics you’d like support with in 2026
Dominique Russell
In our latest reader survey, we asked you what you want support on in 2026. You gave us plenty of suggestions, and they will inform our content planning this year. This infographic presents the most popular topic requests we received – the bigger the font, the more popular the request!
-

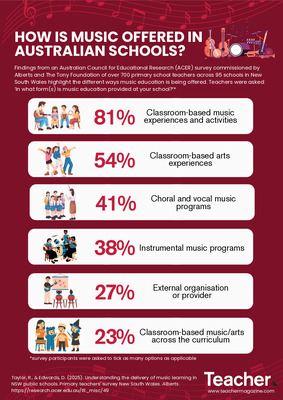
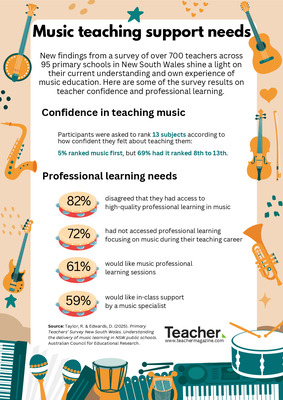
Infographic: How is music offered in Australian schools?
Dominique Russell
Findings from an Australian Council for Educational Research (ACER) survey commissioned by Alberts and The Tony Foundation of over 700 primary school teachers across 95 schools in New South Wales highlight the different ways music education is being offered. Teachers were asked: ‘In what form(s) is music education provided at your school?’. Find out more in today’s infographic.
-

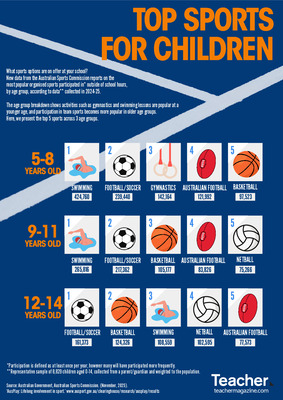
Infographic: Top sports for children
Dominique Russell
What sports options are on offer at your school for 2026? Today’s infographic might serve up some inspiration. It outlines the most popular organised sports participated in outside of school hours, by age group. The data show activities such as gymnastics and swimming lessons are popular at a younger age, and participation in team sports becomes more popular in older age groups.
-

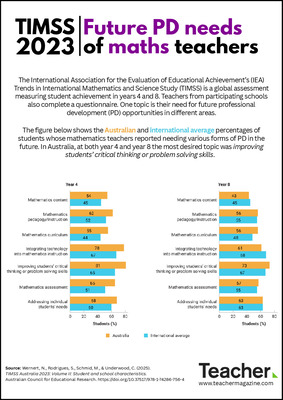
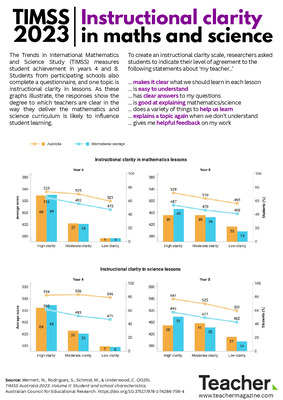
TIMSS 2023 – Infographic: Future PD needs of maths teachers
Jo Earp
The IEA’s Trends in International Mathematics and Science Study (TIMSS) is a global assessment measuring student achievement in years 4 and 8. Teachers from participating schools also complete a questionnaire. Today’s infographic looks at the topics that mathematics teachers reported needing professional development on in the future.
-

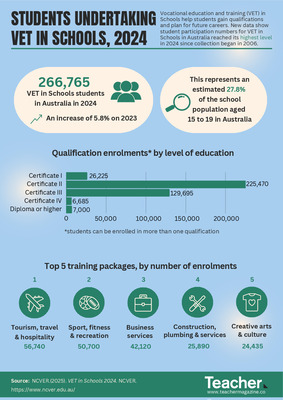
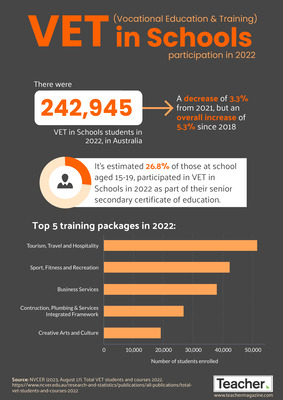
Infographic: Students undertaking VET in Schools
Dominique Russell
Vocational education and training (VET) in Schools help students gain qualifications and plan for future careers. New data show student participation numbers for VET in Schools has reached its highest level in 2024 since collection began in 2006. Find out more in this infographic.
-

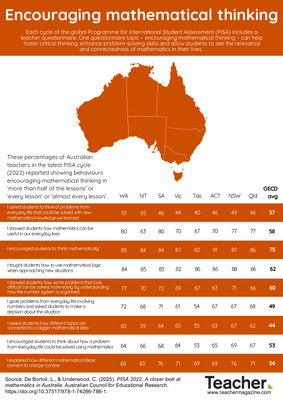
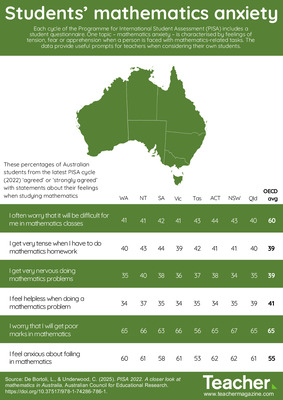
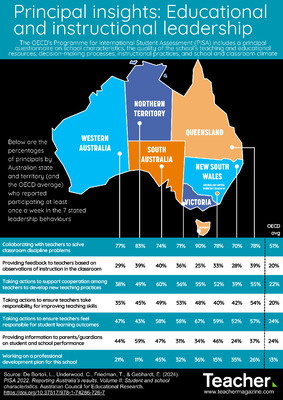
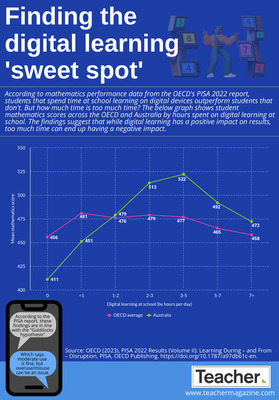
Infographic: PISA insights – encouraging mathematical thinking
Dominique Russell
Each cycle of the global Programme for International Student Assessment (PISA) includes a teacher questionnaire. One questionnaire topic – encouraging mathematical thinking – can help foster critical thinking, enhance problem-solving skills and allow students to see the relevance and connectedness of mathematics in their lives.
-

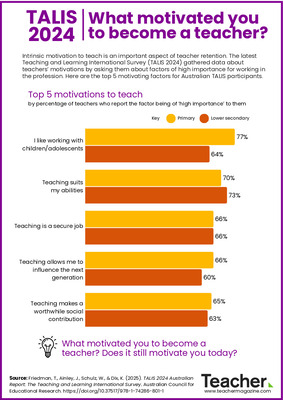
TALIS 2024 – Infographic: What motivated you to become a teacher?
Dominique Russell
Intrinsic motivation to teach is an important aspect of teacher retention. The latest Teaching and Learning International Survey (TALIS 2024) gathered data about teachers’ motivations by asking them about factors of high importance for working in the profession. Here are the top 5 motivating factors for Australian TALIS participants.
-

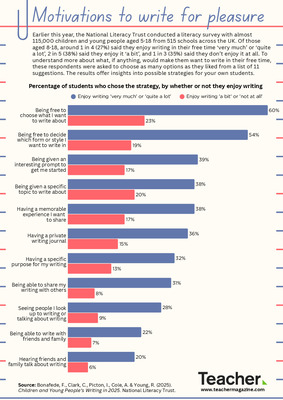
Infographic: Motivations to write for pleasure
Dominique Russell
A survey of 115,000 children and young people aged 5-18 from across the UK asked what, if anything, would make them want to write in their free time by giving them a list of 11 suggestions. The results offer insights into possible strategies for your own students.
-

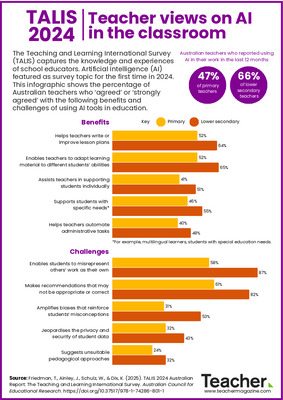
TALIS 2024 – Infographic: Teacher views on AI in the classroom
Dominique Russell and Jo Earp
The Teaching and Learning International Survey (TALIS) captures the knowledge and experiences of school educators. Artificial intelligence (AI) featured as survey topic for the first time in 2024. This infographic shows the percentage of Australian teachers who ‘agreed’ or ‘strongly agreed’ with the following benefits and challenges of using AI tools in education.
-

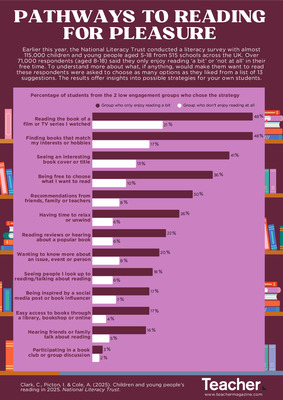
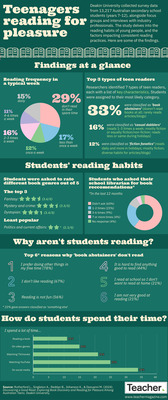
Infographic: Pathways to reading for pleasure
Dominique Russell
A survey of over 115,000 students in the UK found that over 71,000 only enjoy reading ‘a bit’ or ‘not at all’ in their free time. To understand more about what could make them want to read, these respondents were asked to choose as many options as they liked from a list of 13 suggestions. The results presented in this infographic offer insights into possible strategies for your own students.
-

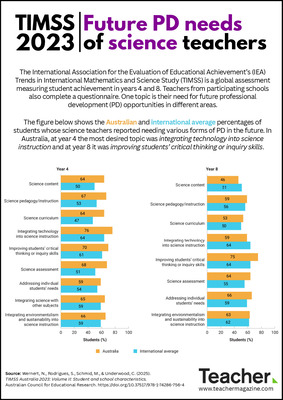
TIMSS 2023 – Infographic: Future PD needs of science teachers
Jo Earp
The IEA’s Trends in International Mathematics and Science Study (TIMSS) is a global assessment measuring student achievement in years 4 and 8. Teachers from participating schools also complete a questionnaire. Today’s infographic looks at the topics that science teachers reported needing professional development on in the future.
-

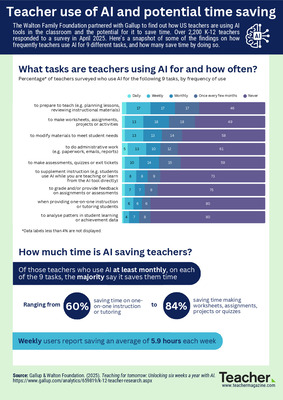
Infographic: Teacher use of AI and potential time saving
Dominique Russell
The Walton Family Foundation partnered with Gallup to find out how US teachers are using AI tools in the classroom and the potential for it to save time. Over 2,200 K-12 teachers responded to a survey in April 2025. Here’s a snapshot of some of the findings on how frequently teachers use AI for 9 different tasks, and how many save time by doing so.
-

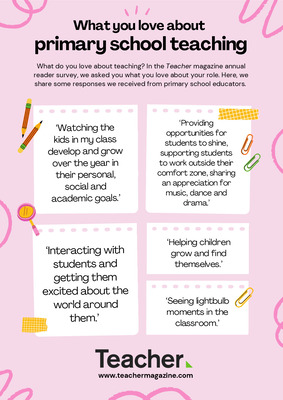
Infographic: What you love about primary school teaching
Dominique Russell
What do you love about teaching? In the Teacher magazine annual reader survey, we asked you what you love about your role. Here, we share some responses we received from primary school educators.
-

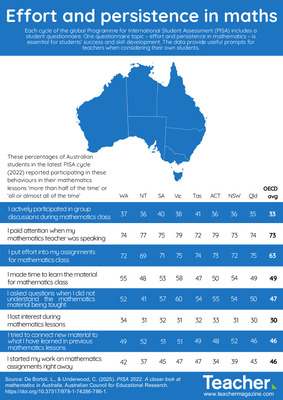
Infographic: PISA 2022 insights – effort and persistence in maths
Dominique Russell
Each cycle of the global Programme for International Student Assessment (PISA) includes a student questionnaire. One questionnaire topic – effort and persistence in mathematics – is essential for students’ success and skill development. The data provide useful prompts for teachers when considering their own students.
-

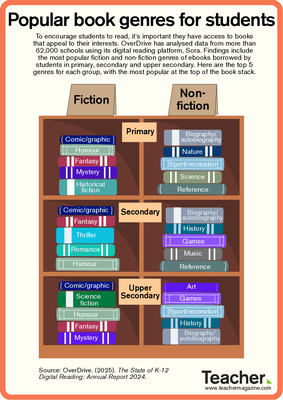
Infographic: Popular book genres for students
Dominique Russell
To encourage students to read, it’s important they have access to books that appeal to their interests. This infographic shares the most popular fiction and non-fiction genres of ebooks borrowed by students in primary, secondary and upper secondary.