
Infographics from ACER's Teacher magazine.
-

Infographic: Rates of school attendance
Jo Earp
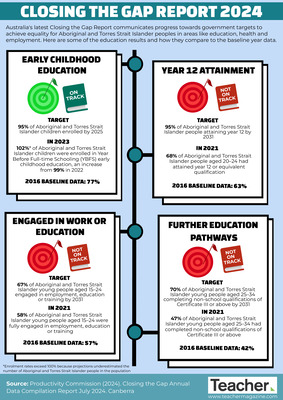
Australia's annual Closing the Gap Report details progress against government targets in the areas of health, education and employment. This infographic focuses on the rates of school attendance, comparing Indigenous and non-Indigenous student groups.
-

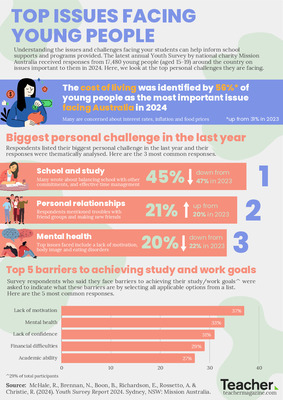
Infographic: Important issues for young people
Jo Earp
The latest instalment of Mission Australia's annual Youth Survey reveals mental health is now perceived to be the number one concern for young people aged 15 to 19. This infographic looks at the six issues chosen as most important by 2017 survey participants, and the trends since 2015.
-

Infographic: Students arriving late to school
Jo Earp
The OECD has collected data on student lateness from school systems in countries and economies around the world. Today’s infographic looks at some of the results.
-

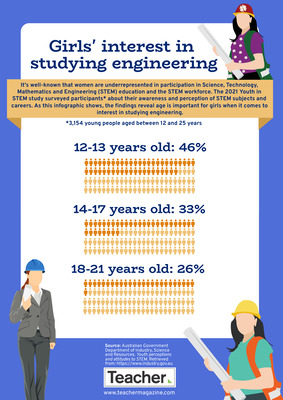
Infographic: Teenage internet piracy behaviours at school
Jo Earp
In recent research commissioned by Creative Content Australia, young people aged 12 to 17 were asked about internet piracy behaviours and attitudes. Here are the proportions of survey participants in three different age groups who downloaded or streamed pirated movies or TV shows while at school.
-

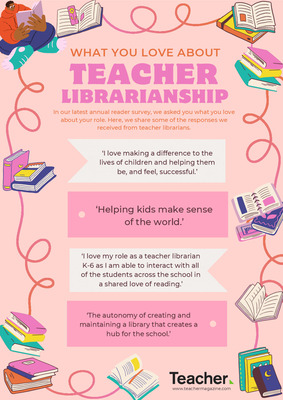
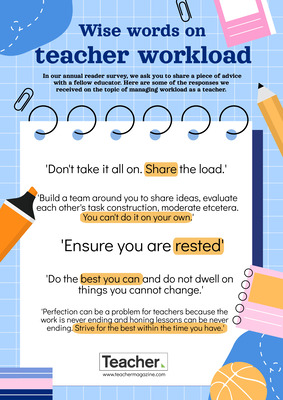
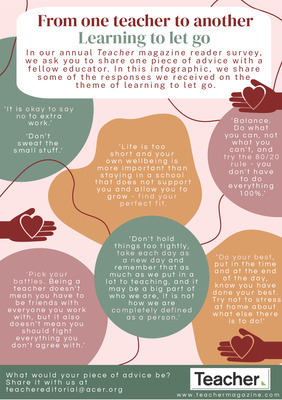
Infographic: Educators share advice on wellbeing
Rebecca Vukovic
The 2017 Teacher reader survey included the question: 'Looking back on your experience as an educator, if you could share one piece of advice with your peers, what would it be?' Here are some responses on the topic of wellbeing.
-

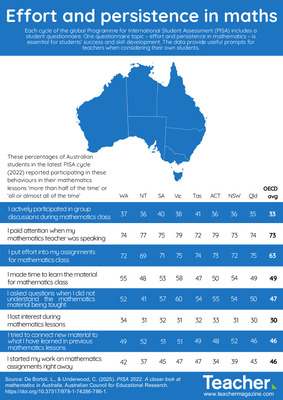
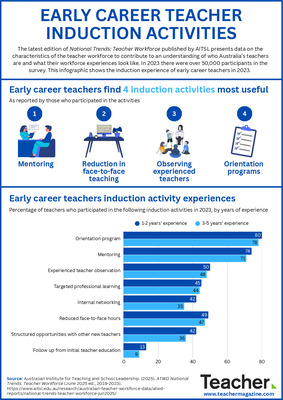
Infographic: Early career teacher induction
Jo Earp
A new report from the Australian Institute for Teaching and School Leadership includes data on the experiences and attitudes of early career teachers about their induction in schools.
-

Infographic: Educator mental health and wellbeing
Jo Earp
UK charity Education Support Partnership recently commissioned a large-scale survey into the mental health and wellbeing of education professionals. Our latest infographic reports on some of the findings from the survey.
-

Infographic: Wise words on relationships
Rebecca Vukovic
In the annual Teacher survey, we ask readers: 'Looking back on your experiences as an educator, if you could share one piece of advice with your peers what would it be?' Here are some of the responses received on the topic of relationships.
-

Infographic: Teacher behaviour hindering learning
Jo Earp
The 2015 PISA test cycle included a survey of principals. Principals were asked to report on five teacher-related behaviours which are hindering learning. This infographic shows the percentage of students whose principals reported the behaviours occurring 'to some extent' or 'a lot'.
-

Most borrowed picture books
Jo Earp
The annual Civica Libraries Index compiled a list of the top 10 most borrowed picture books from regional and metropolitan libraries across Australia. So, which popular titles made the coveted list? Find out in today's infographic.
-

Where do students get their money from?
Rebecca Vukovic
The OECD programme for International Student Assessment (PISA) in 2015 examined 15 year old students’ financial literacy skills. This infographic compares the main sources of income for students from Australia, with the average from participating OECD countries.
-

Financial Literacy
Jo Earp
An international assessment of 15-year-old students' financial literacy includes data on their experiences, attitudes and behaviours, as well as their academic performance. Here are some of the findings from Australia.
-

Infographic: Books in the home and student achievement
Rebecca Vukovic
The Trends in International Mathematics and Science Study (TIMSS) is an international comparative study of student achievement. Here, we look at TIMSS data on books in the home and the percentage of Australian students at or above the proficient standard for maths and science.
-

Infographic: Student behaviour hindering learning
Jo Earp
In PISA 2015 principals were asked to report on five student-related behaviours which are hindering learning. This infographic shows the percentage of students whose principals reported the behaviours occurring at least once a month.
-

Infographic: School teaching as a highly regarded profession
Jo Earp
Since 1976, a Roy Morgan annual survey has asked Australians to rate 30 professions for ethics and honesty. This year, the rating for school teachers hit an all-time high. Find out more in today's infographic.
-

Infographic: Student wellbeing and PE classes
Jo Earp
The latest cycle of PISA explored the wellbeing of 15-year-old students. Survey topics included Physical Education classes at school. Here are results from a selection of the 70+ countries and economies that participated.
-

Infographic: Student exercise outside school
Jo Earp
How do students in Australia compare with their counterparts in New Zealand, Singapore and the UK when it comes to physical exercise before and after school? Our latest infographic explores new OECD data.
-

Infographic: Offensive behaviour against school leaders
Jo Earp
The 2016 Australian Principal Health & Wellbeing Survey includes prevalence rates of offensive behaviour against school leaders, compared to the general population. Our latest infographic explores some of the results.
-

Infographic: More wise words on teacher wellbeing
Rebecca Vukovic
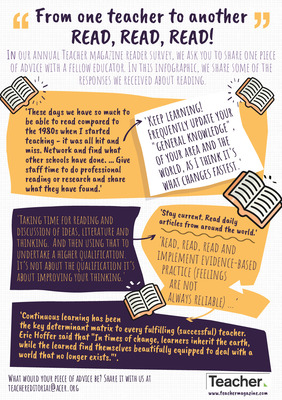
Our annual survey asks: 'If you could share a piece of advice with a fellow educator, what would it be?' Today's infographic features more wise words from Teacher readers on the topic of wellbeing.
-

Infographic: Cyberbullying and other digital dangers
Rebecca Vukovic
In 2016 the Office of the Children's eSafety Commissioner undertook a national survey of kids, teens and parents, to ask them about their internet use and online practices. Here are some of the findings.
-

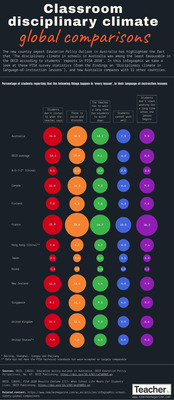
Infographic: Classroom discipline
Jo Earp
In the 2015 PISA cycle, students were asked to respond to five statements about the disciplinary climate in their science classes. Here are the results from 10 participating countries.
-

Infographic: Classroom seating arrangements
Jo Earp
Are you ‘old school’ when it comes to your classroom seating layout? Do you prefer small groups or an arrangement that leaves space in the middle? Here are just a few of the many (many) variations out there.
-

Infographic: Workload and quality of teaching
Jo Earp
A recent school staff workload survey in Victoria, Australia asked teachers to consider 17 demands of quality teaching. Here are some of the results.
-

Infographic: How much time are Australian kids spending on screens?
Rebecca Vukovic
The Australian Government's Department of Health recommends a maximum of two hours per day of screen time for entertainment for kids aged five to 12, but how many children adhere to these guidelines?
-

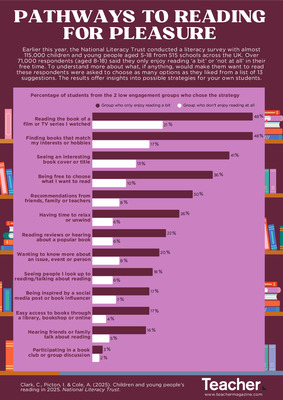
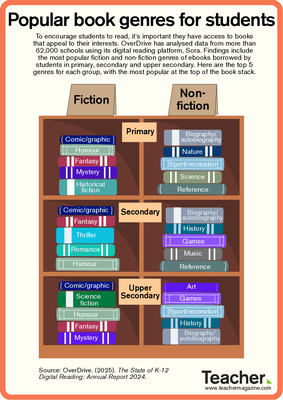
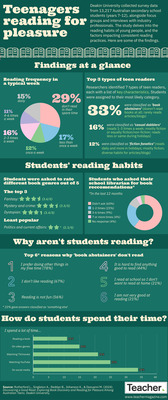
Infographic: Teen reading habits
Jo Earp
A new research study involving academics from Deakin University and Murdoch University is exploring the recreational reading habits of Australian teenagers. Here are some of the early findings.